Blog · July 9, 2026
Feeding the Shapes of 11,027 Stories Into a Computer
A recommendation engine dies on contact with a long-dead API, and a Kurt Vonnegut essay picks up the pieces. 11,027 novels charted by an LLM: the shapes stories make, the fingerprints of genre, and a century of darkening first chapters.
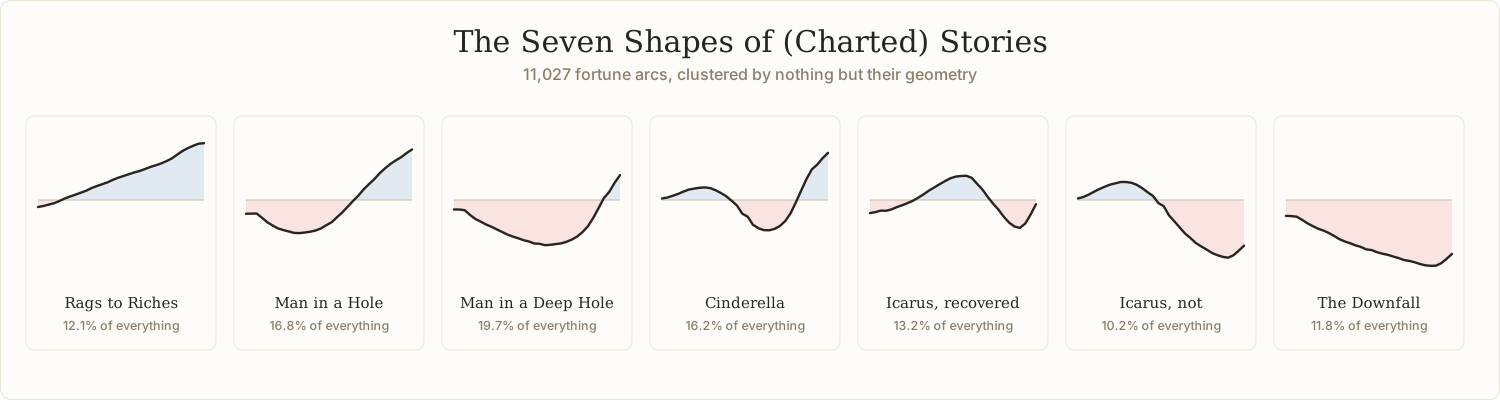
Somewhere in every programmer's home directory there is a folder of retired side projects, and somewhere in mine there was a Python scraper that spoke fluent Goodreads API. It had been sitting untouched for years, and this spring I finally had a new job for it: a book recommendation engine. The plan was straightforward:
- Sync the Open Library catalog (open data with bulk dumps, the whole bibliographic universe for free) to serve as the canonical record of what books exist.
- Dust off the Goodreads scraper to layer on what people think of them.
- Build the recommendation engine on top of the two.
I built the data side first. The Open Library sync came together nicely: a proper pipeline, resumable, deduplicating, chewing through data dumps until 2,223,280 books sat in my catalog. Then I went to revive the scraper, navigated to the Goodreads developer page to mint a fresh API key, and learned that Goodreads shut down its public API in several years ago, like many other formerly open APIs.
Change of plans
So there I was with a catalog of 2.2 million books, a working sync pipeline, and no reason for either to exist. As it happened, I was reading Kurt Vonnegut essays that same week, which included an overview of his rejected master's thesis: that stories have shapes, and you can draw them. Put time on the horizontal axis, from Beginning to End. Put the protagonist's fortune on the vertical, from Good fortune to Ill. Then trace the line. Cinderella has a shape. Hamlet has a shape (a famously flat, ambiguous one). His favorite, the workhorse of Western storytelling, he called Man in a Hole: somebody gets into trouble, gets out of it, and ends up better off than where they started. The University of Chicago rejected the thesis because, he claimed, it was too simple and looked like too much fun.
In one lecture on the subject he says:
There's no reason why the simple shapes of stories can't be fed into computers. They are beautiful shapes.
So let's do that!
People have taken real swings at it before, most famously a 2016 University of Vermont paper that ran sentiment analysis over about 1,300 Project Gutenberg novels and found six basic emotional arcs. But word-level sentiment measures the mood of the prose, not the fortune of the protagonist, and those are different instruments. A hero grimly winning a battle scores as negative; a beloved character's funeral, described tenderly, scores as positive. Vonnegut wasn't plotting vocabulary, he was plotting how it's going for our hero, which requires actually reading the story and making a judgment call. That happens to be the kind of thing LLMs are good at, and as far as I can tell, nobody had used them to do it at scale.
I had the catalog. I had the pipeline. The recommendation engine got shelved, and the Fortune Arc Explorer took its place. It's live at fortune-arcs.klingelhofer.me if you'd like to poke at it.
Part 1: Turning a library into curves
The winnowing
Two-point-two million books sounds like a lot of literature until you start asking each one for its plot.
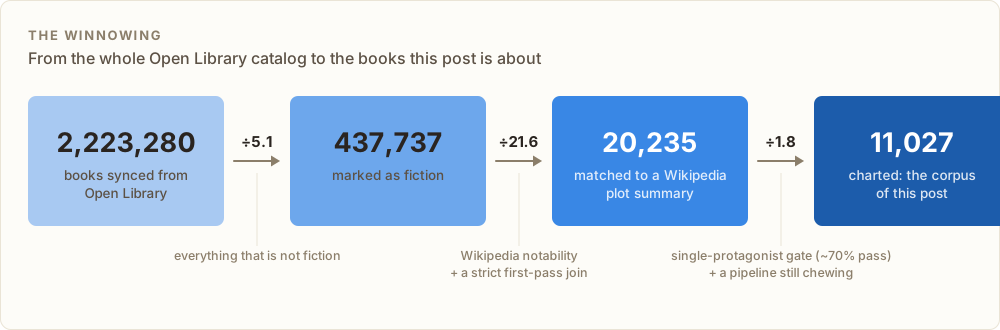
Figure 1. The pipeline, from everything Open Library knows about to the books this post is actually about.
The first cut is easy: most of a library isn't fiction, and you can't chart the fortune arc of a cookbook. That leaves 437,737 novels. The second cut is the big one: to chart a story the model has to be able to read it, and the most consistent, legally comfortable source of plot summaries is Wikipedia. Joining the catalog against Wikipedia leaves 20,235 books with a usable plot summary. Part of that is Wikipedia's notability bar (most books never get an article, let alone a plot section), but a good chunk of it is my own doing: the join is strict, and it throws away any book-to-article match it isn't completely sure about. Fuzzier matching would recover a lot of books. But this was a first pass, and ten-thousand-plus books turned out to be plenty to draw insights from, so I kept the strict version and moved on. Worth keeping in mind, though: everything below is a portrait of books Wikipedia bothered to summarize, not of fiction at large.
The last gate is structural: the graph tracks one protagonist's fortune, so each plot is screened for whether it actually has a chartable single-protagonist narrative (anthologies, essay collections dressed as novels, and sprawling ensemble casts get benched). About 70% pass, and as of this snapshot 11,027 books have been fully charted, with the pipeline still chewing.
Of course, this has many omissions, but and we could likely add in far more if we desired to, but around 10k is not terribly expensive to evaluate, and certainly enough to draw insights, so I left it there.
How a book becomes a shape
For each book, the model reads the plot summary, identifies the protagonist, and places their fortune on a −100…+100 scale at each key moment of the story (a wedding day lands in the +90s, orphaned in chapter one sits around −60). Different books have different numbers of narrative beats, so every arc is resampled onto 32 evenly spaced points from Beginning to End, which makes the whole corpus comparable: every story becomes a curve, every curve lives on the same axes, and suddenly you can do arithmetic on literature. The model also names the shape it thinks it just drew, freehand, which becomes important later.
The bill
Charting the fortunes of eleven thousand novels cost only a few dollars. The arcs were drawn by a budget-tier model (DeepSeek's flash tier, via OpenRouter) that runs about 50× cheaper than the frontier models. I spot-checked its charts against what Sonnet- and Opus-tier models produced on the same books, expecting to find the gap that justified the price difference, and for this task (read a summary, judge a fortune, place a number) there wasn't one. To be fair, this is a bounded task, not the deep multi-step reasoning that separates the frontier from everything beneath it. But "read this plot and tell me how it's going for the hero" is not nothing, and the cheapest tier of model now does it about as well as the most expensive.
(There are likely many tasks of typical complexity that these very cheap models can perform, calling into question the long-term likely success of OpenAI/Anthropic upcoming IPOs, but that's a conversation for another time.)
Part 2: What 11,027 arcs actually look like
The average book is a man in a hole
Take every charted arc in the corpus -- comedy and tragedy, classic and airport paperback -- and average them into a single line. You'd expect mush. You get this:
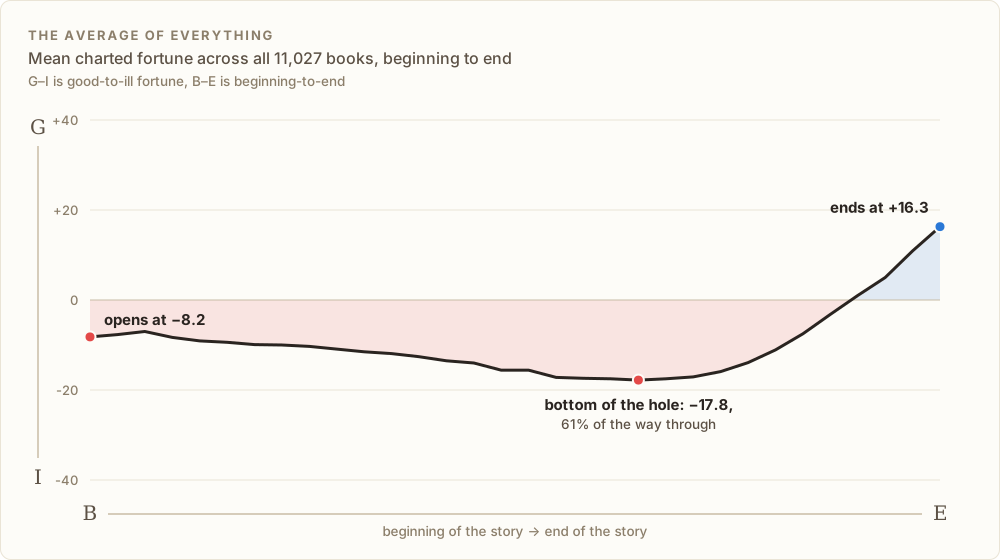
Figure 2. The mean charted fortune across the entire corpus. Blue shading is good fortune, red is ill.
The average story opens slightly underwater at −8.2, sinks steadily to −17.8 about 61% of the way through (right where an editor would tell you the dark night of the soul belongs), then climbs to close at +16.3. Things get worse, then they get better, and they end better than they began, very similar to Vonnegut's description of the average story shape in his essay.
Seven shapes, not one
Originally I had the LLM choose tag either from a set of possible options, or creating its own where they didn't adhere. The man_in_a_hole tag is doing a suspicious amount of work, though, so I did what you do when you don't fully
trust a label: ignore it, and let the curves sort themselves. Running k-means over the raw 32-point curves (k=7,
chosen for legibility, not because seven is cosmically true) produces seven families, and they land remarkably close
to the thesis's original taxonomy:
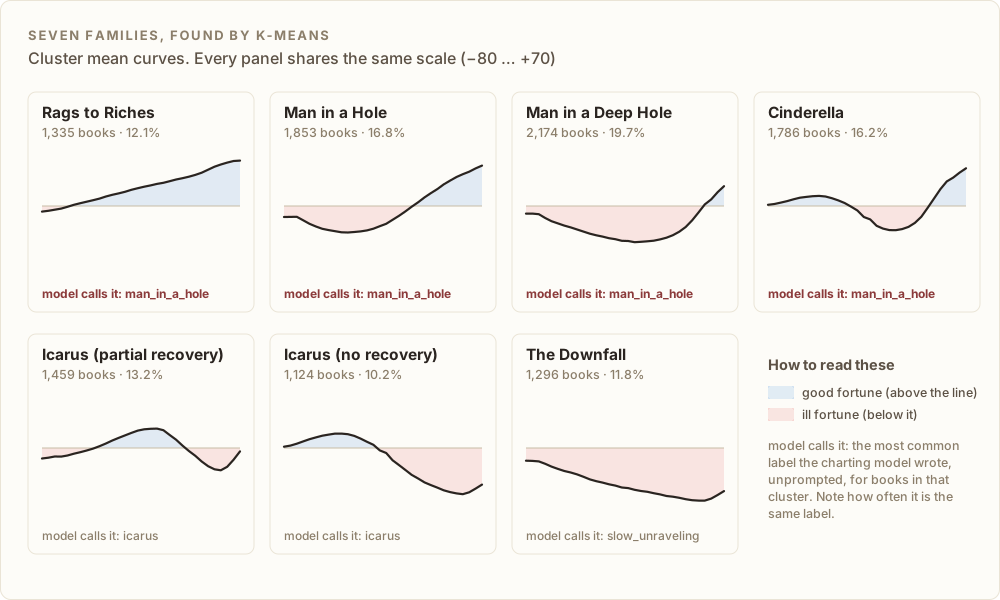
Figure 3. The seven families, discovered by clustering rather than assumed, ordered roughly from sunniest to bleakest. Under each: the label the model most often wrote, unprompted, for books in that cluster.
Narrative Patterns in Genres
Cross those seven families with genre tags and every genre turns out to have a signature: a characteristic way it over- or under-uses the seven shapes, relative to the corpus baseline:
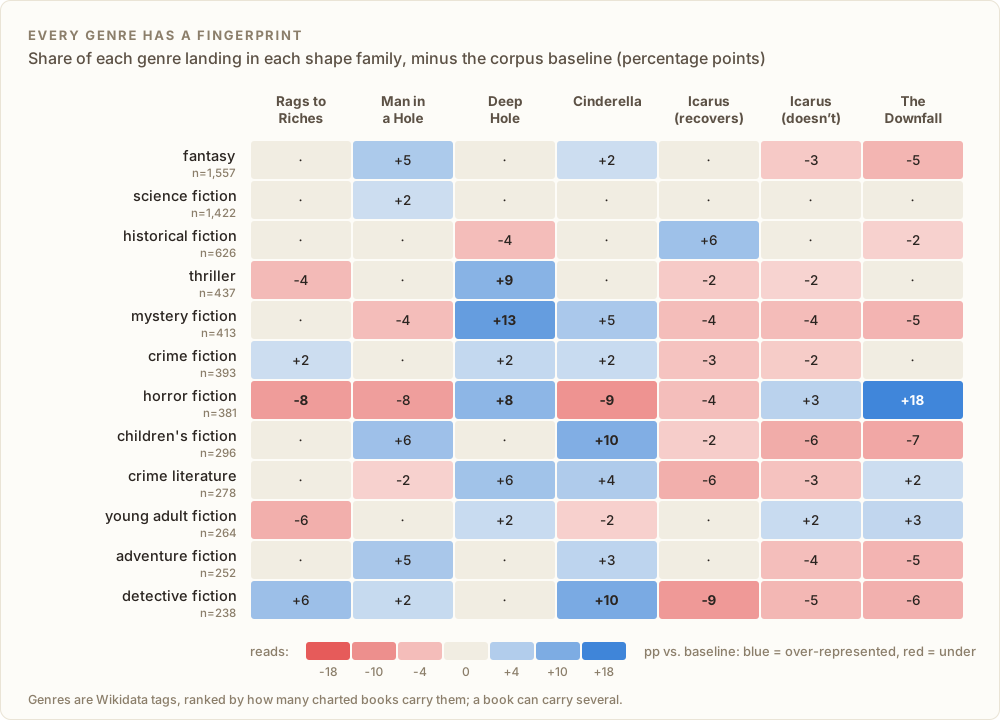
Figure 4. Percentage-point deviation from the corpus baseline. Blue means the genre over-uses that shape; red means it avoids it.
A few that stand out:
- Horror doesn't do redemption. It leans into The Downfall, the one shape with no third-act recovery, at +18 points over baseline (the largest deviation anywhere in the table), while avoiding every things-work-out shape. Dystopian fiction, which falls just below this table's population cutoff, posts nearly the identical signature.
- Mystery and detective fiction split a hair. Mystery over-indexes +13 on Man in a Deep Hole: the case deepens, the case resolves. Detective fiction is the only genre in the table whose average book opens above neutral (+1.5 -- the detective is doing fine until the client walks in), and it leans harder into Cinderella than anything else here: a case that seems solved, isn't, and then really is.
- Children's fiction has the biggest net gain in the table, opening at −5.7 and closing at +42.8. We still drop children's protagonists into holes; we just make sure to haul them out much higher.
The opening chapter has gotten darker
Restrict to the 10,617 books with a known publication year from 1900 on, and one trend survives contact with a scatterplot:
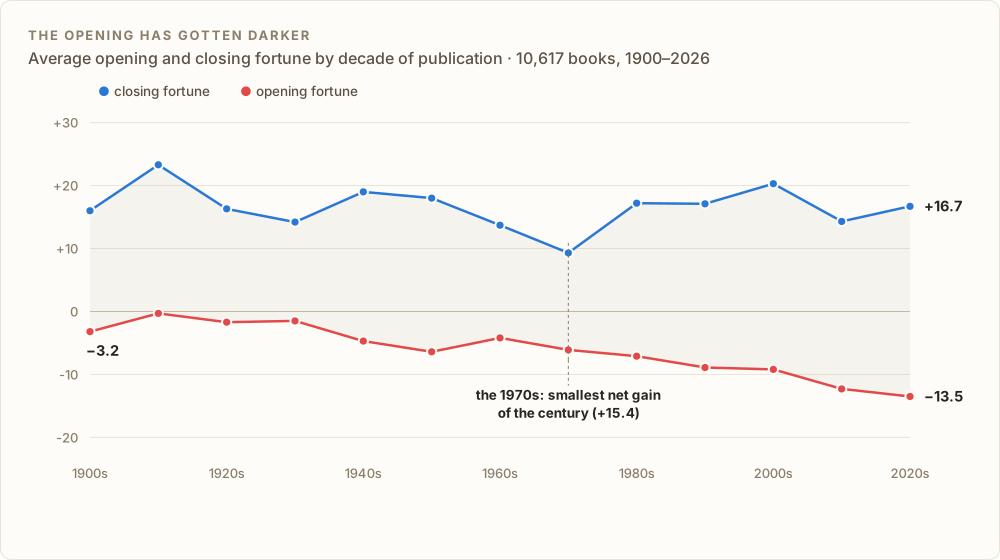
Figure 5. Average opening and closing fortune by decade of publication. The shaded band between the lines is the height of the redemption arc, and it's been getting taller.
The average opening fortune has slid from −3.2 in the 1900s to −13.5 in the 2020s, a drift of about a point per decade (r=−0.10; a lean, not a cliff, steepening after 1980). Endings, meanwhile, have barely moved in a century. The net effect is that the redemption arc has gotten taller: we increasingly open our stories from a worse place, and climb to roughly the same spot we always did. It shows in the shape mix too: the 1900s over-indexed on the simple Rags to Riches climb by +11.6 points, and by the 2000s that balance had fully reversed toward the deep-struggle shapes.
Two decades deserve footnotes. The 1970s post the smallest net fortune gain of the entire century (+15.4); it was not an optimistic decade. And the biggest net gain of any complete decade belongs to the 2000s (+29.6), though the 2020s are currently running even higher (+30.2) with only 439 books charted and most of the decade still unwritten. Make of that what you will.
A bonus round of national stereotypes, empirically measured
The corpus also carries national-literature tags, and I couldn't resist this table:
| Tradition | Books | Opens | Closes | Net |
|---|---|---|---|---|
| French | 619 | −6.9 | +19.7 | +26.6 |
| American | 1,592 | −8.9 | +11.8 | +20.7 |
| British/Irish | 1,730 | −5.2 | +8.9 | +14.1 |
| Russian | 22 | −16.2 | −0.1 | +16.1 |
| German | 58 | −5.2 | −25.2 | −20.0 |
British fiction: starts comfortable, ends mildly improved, no fuss. Russian literature opens from the darkest starting point of any tradition measured and spends the whole book clawing its way back to precisely −0.1, climbing all the way out of the abyss to arrive at almost zero, which may be the most Russian statistical result ever computed. And German literature is the only tradition in the data whose average book ends worse than it began, by twenty full points.
Of course, this covers only the handful of foreign language works which have heavy English presence, were captured by my rough join strategy, and have English wikipedia pages -- so take with a massive grain of salt, but I did still find it amusing and so work sharing.
Wrapping up
I set out to build a recommendation engine and instead ran a census of the shapes of fiction, because a dead API and a Vonnegut essay collided in the same week. The average book really is a man in a hole. Horror really does refuse the ladder out. And our opening chapters really have been getting darker for a century while our endings hold steady, our hole is getting deeper. What this means about the state of society and people's outlook, I'll leave to the philosophers and sociologists.
The whole thing is live at fortune-arcs.klingelhofer.me -- go look up a book you love and see the shape it makes, or have fun finding stories in extremely unconventional shapes. (Starting in despair, rising to ectasy, and then falling to even deeper despair is an especially fun one.)